Menu bar
CPU and memory pressure in the menu bar, and a menu with the top apps and the latest alerts.
The menu bar item shows two small numbers: CPU over MEM (memory pressure), for example “CPU 31%” over “MEM 49%”. Each number has the width of “100%”, so the item never changes width.
- A short bar before a number marks its level: yellow at a warning, red at critical. CPU uses the System CPU rule, and memory uses the pressure level of macOS.
- A dot at the left shows while an alert is unread. Its colour is the colour of the worst unread alert.
The menu
Click the item to open its menu.
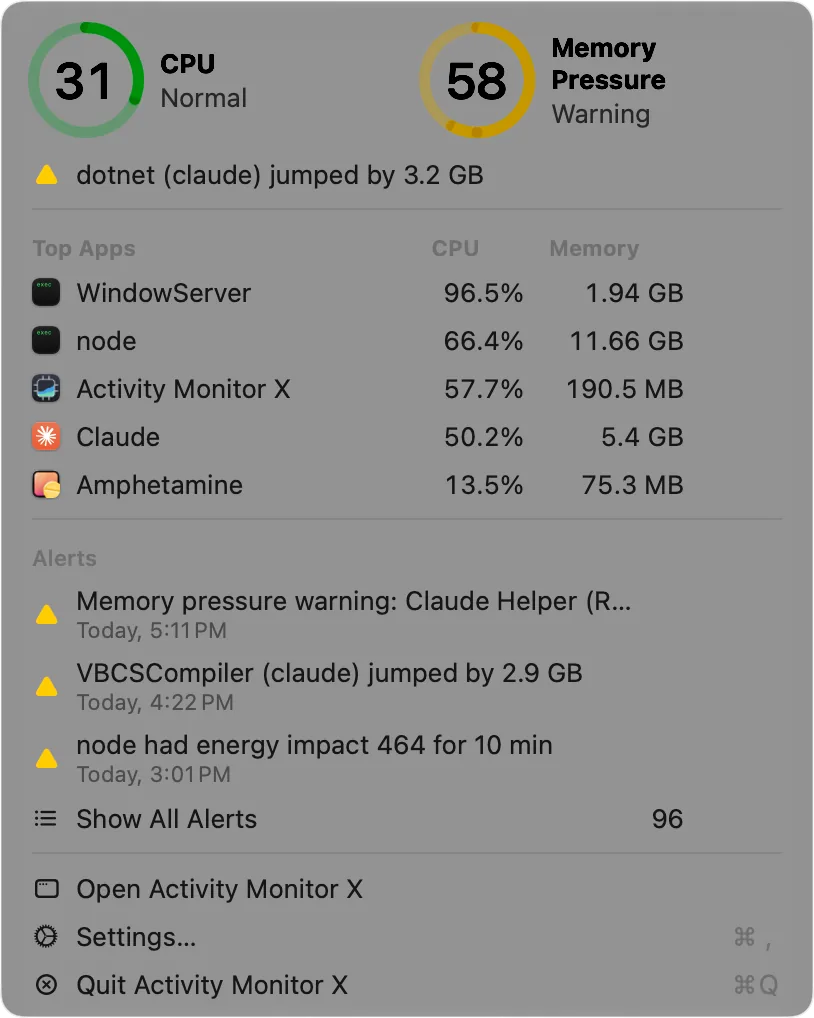
- CPU and Memory Pressure as gauges, green when normal, yellow at a warning and red at critical.
- The newest unread alert.
- Top Apps with their CPU and memory. Click an app to open it in Apps, selected.
- Alerts: the latest alerts with their time, then Show All Alerts with the count.
- Open Activity Monitor X, Settings… and Quit Activity Monitor X.
The menu reads live data from the helper only while it is open. It follows the system appearance, as other menu bar menus do.
Settings
In Settings > General:
- Show in menu bar turns the item on or off. While it shows, closing the window keeps the app running, so new alerts still notify.
- Menu bar colours: Colour (the default) or Greyscale. Greyscale draws the level bars and the dot in the colour of the menu bar.