Inspector
The pane at the right that shows the details of what you select, or a summary when you select nothing.
The inspector is a floating pane at the right of the window. Click the Inspector button in the toolbar, or choose View > Show Inspector, to show or hide it. The window does not change size when the inspector opens. The content column gets narrower.
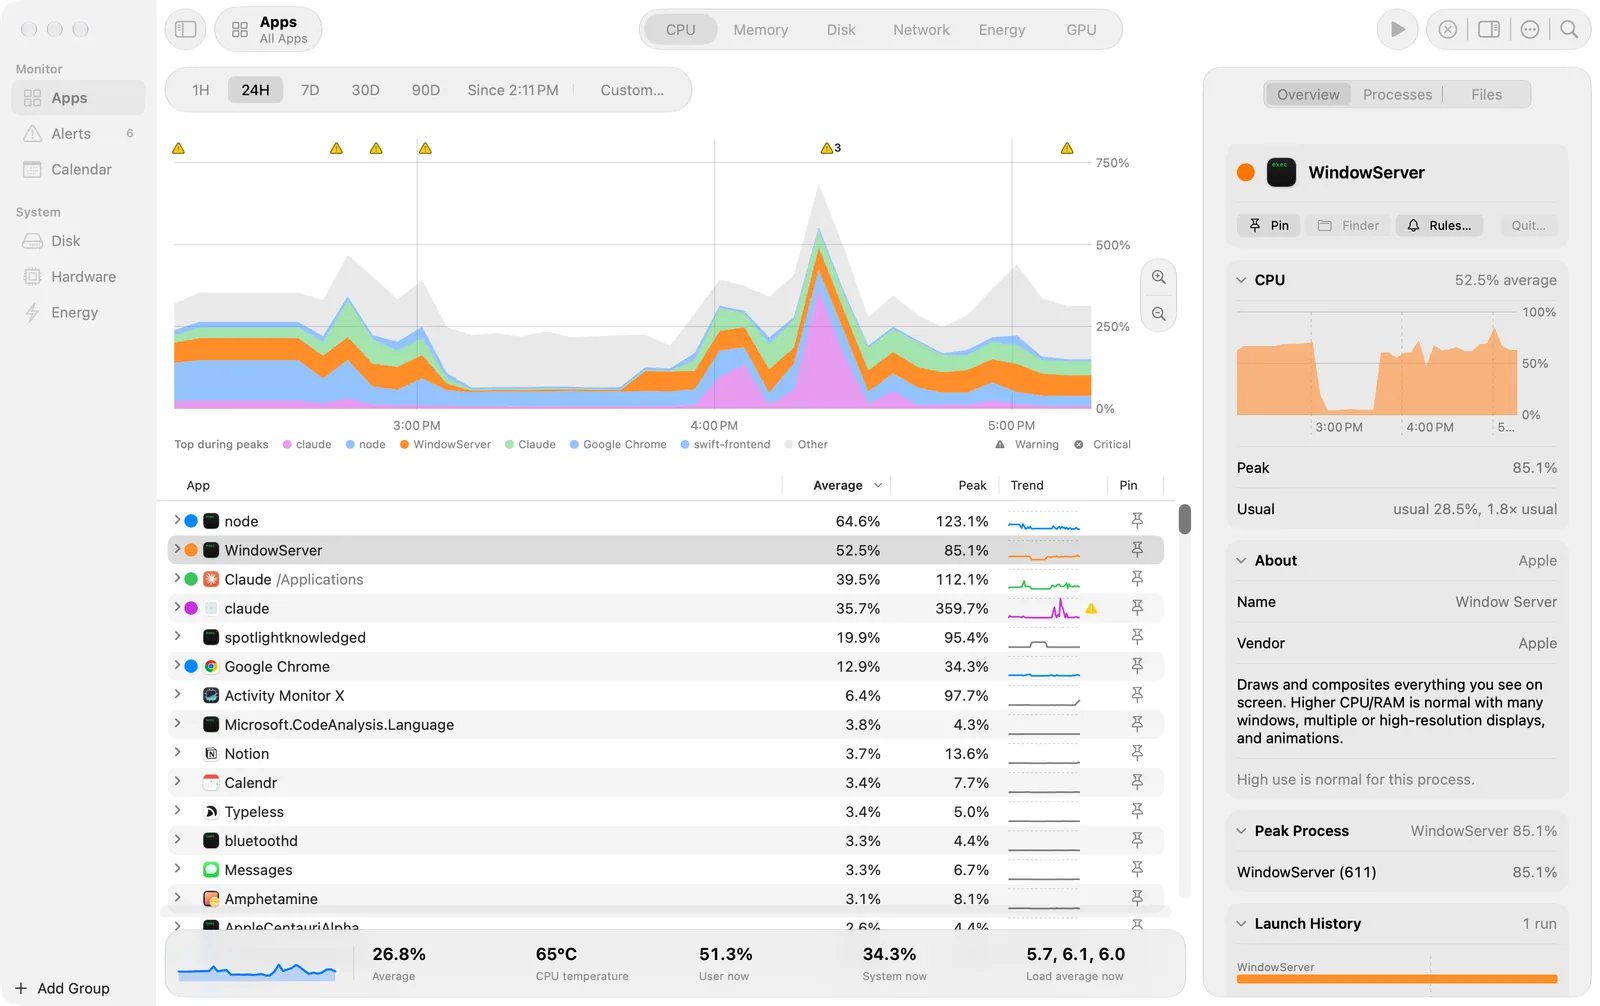
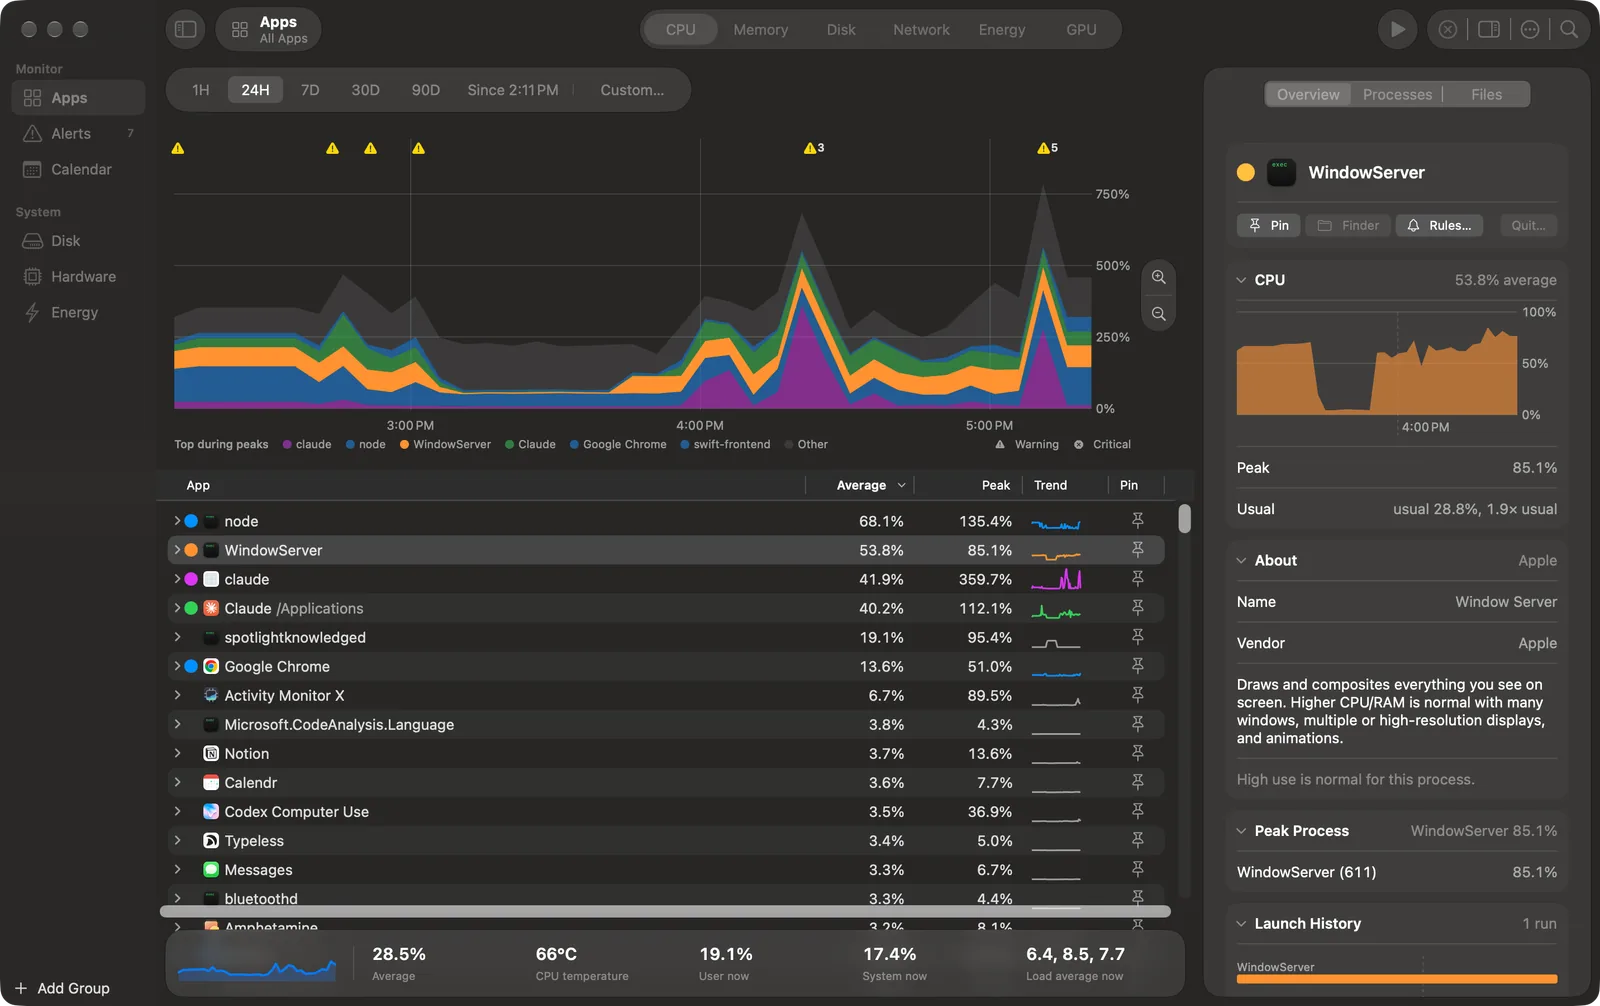
With an app selected
The pills at the top are Overview, Processes and Files.
Overview
- Header: the app’s colour dot, icon and name.
- Action row: Pin, Finder, Rules… and Quit…. Quit asks first, and its confirmation also has Force Quit.
- Metric card: the chart of the app for the metric. Its summary is the average (“52.5% average”). Its rows are Peak and Usual. Usual is the typical value of the app for the time shown, as an hourly mean. Live has no Usual row.
- Launch History: each run of the app as a bar. Click a run to select that time on the chart.
- Alerts of the app. Click an alert to select its time on the chart.
Processes
The processes of the app, under Running and Exited, each with a count. The list keeps the selection and works with the arrow keys.
Files
The files that each process has open, with one card per process and its PID as the summary. Files shows only your own processes: macOS does not let the app read the open files of other users.
With nothing selected
On Apps, the inspector shows a summary of the Mac:
- System Health: memory pressure, swap used, thermal state and uptime. Its summary is the worst state.
- Top Apps: the apps with the highest value of the metric.
- Biggest Changes: the apps whose use went up or down most, compared with the time before.
- Alerts: the count of each kind of alert.
Calendar, Disk, Hardware and Energy show their own summary when nothing is selected. See each screen’s page.
Cards
Each titled section is a card. Click its title to open or close it. A closed card still shows its summary at the right: an average, a peak, a count, a state or a name. The app keeps each card open or closed by its title.
Alert rules for one app
Click Rules… to give the app its own alert values. For each rule, choose As in Settings, Own Values or Off. Mute alerts for this app stops all of its alerts. See Alerts for the rules.