curl -fsSL https://amx.henry.wang/install.sh | shPaste in Terminal: it installs the app and the helper, then opens the app.

Activity Monitor X records what each process on your Mac does and keeps the history, so you can see what made your Mac slow, and when.
curl -fsSL https://amx.henry.wang/install.sh | shPaste in Terminal: it installs the app and the helper, then opens the app.
Needs macOS 26 and Apple silicon. Free and open source under the MIT license.
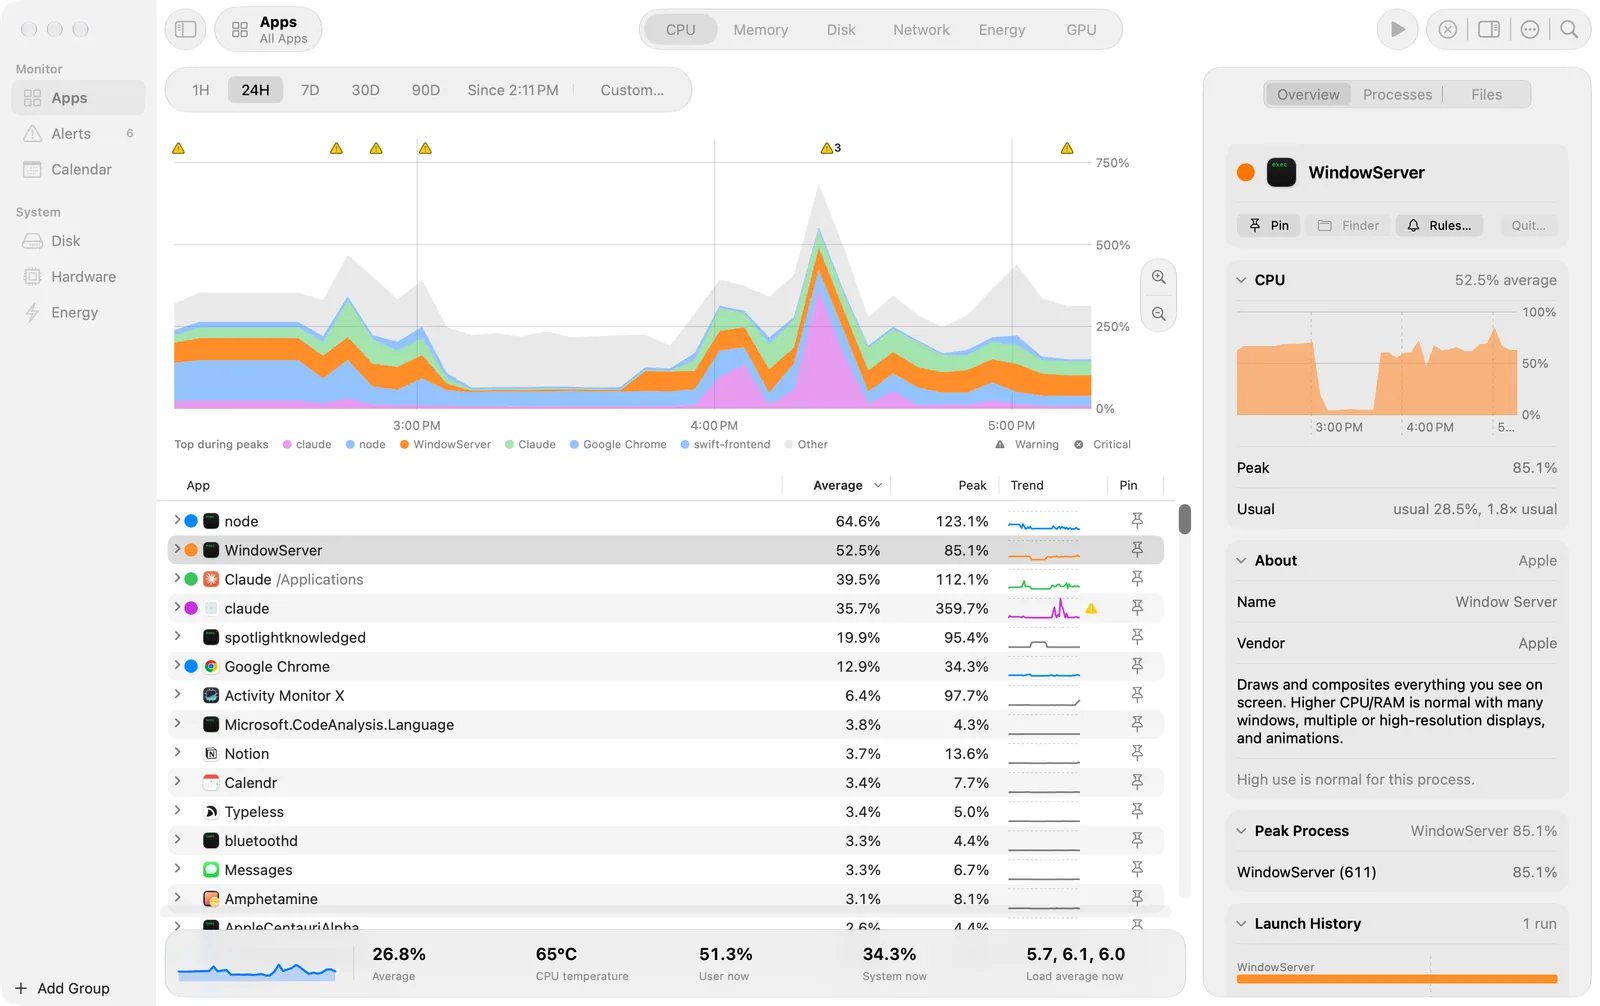
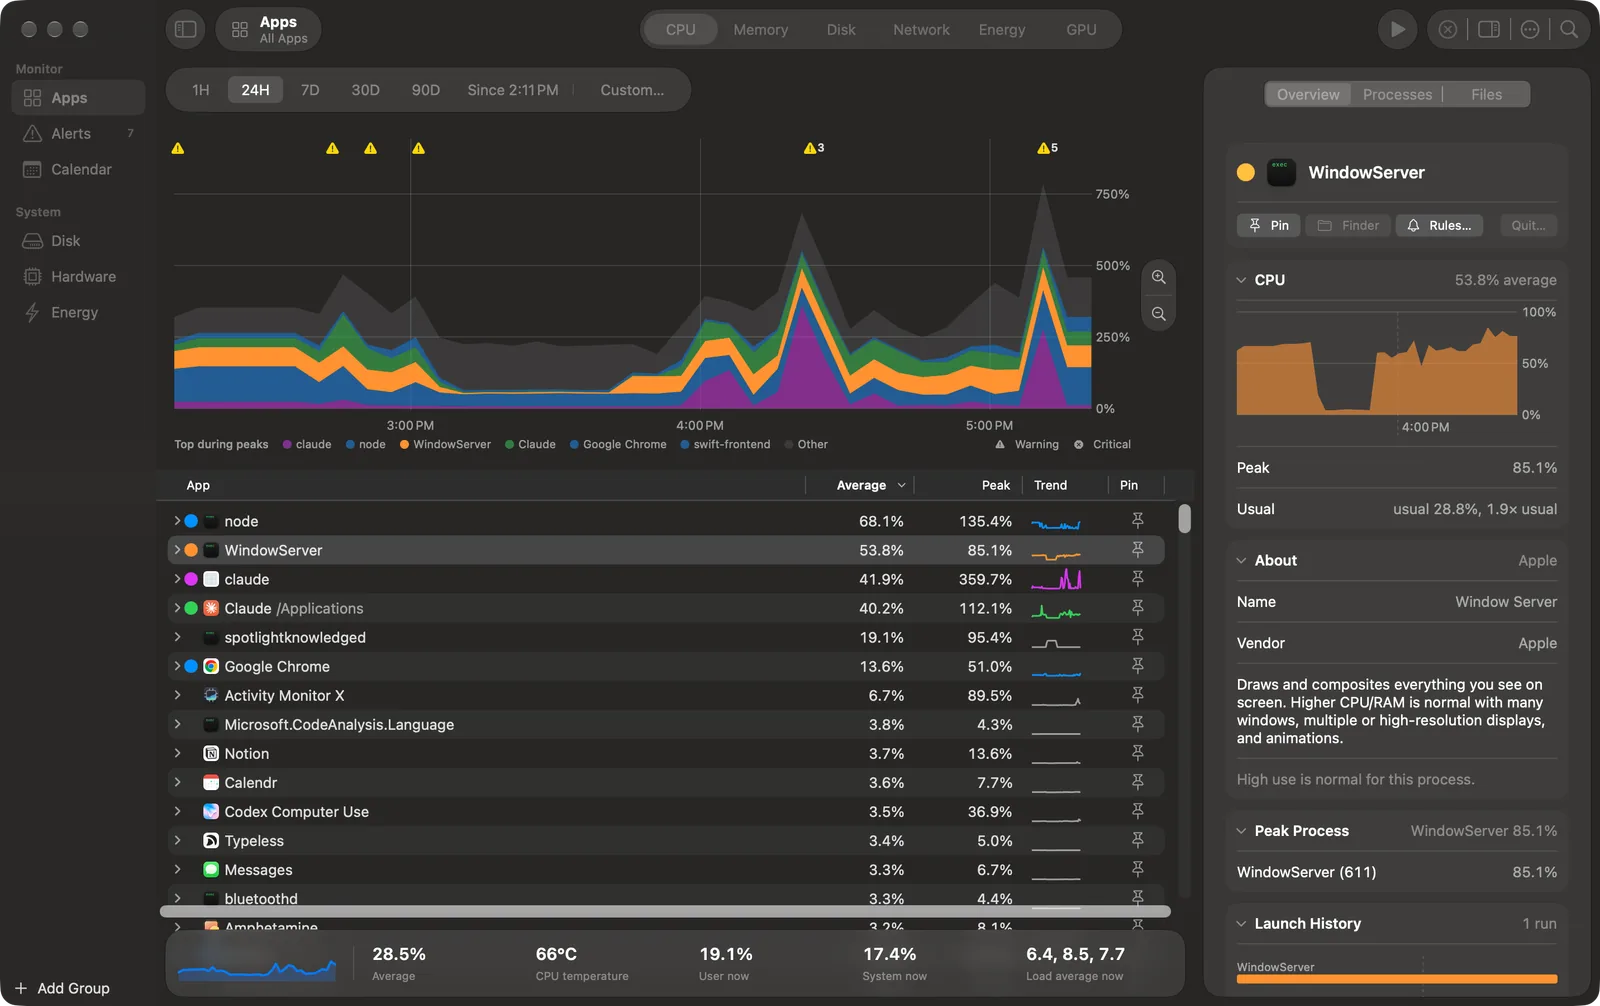
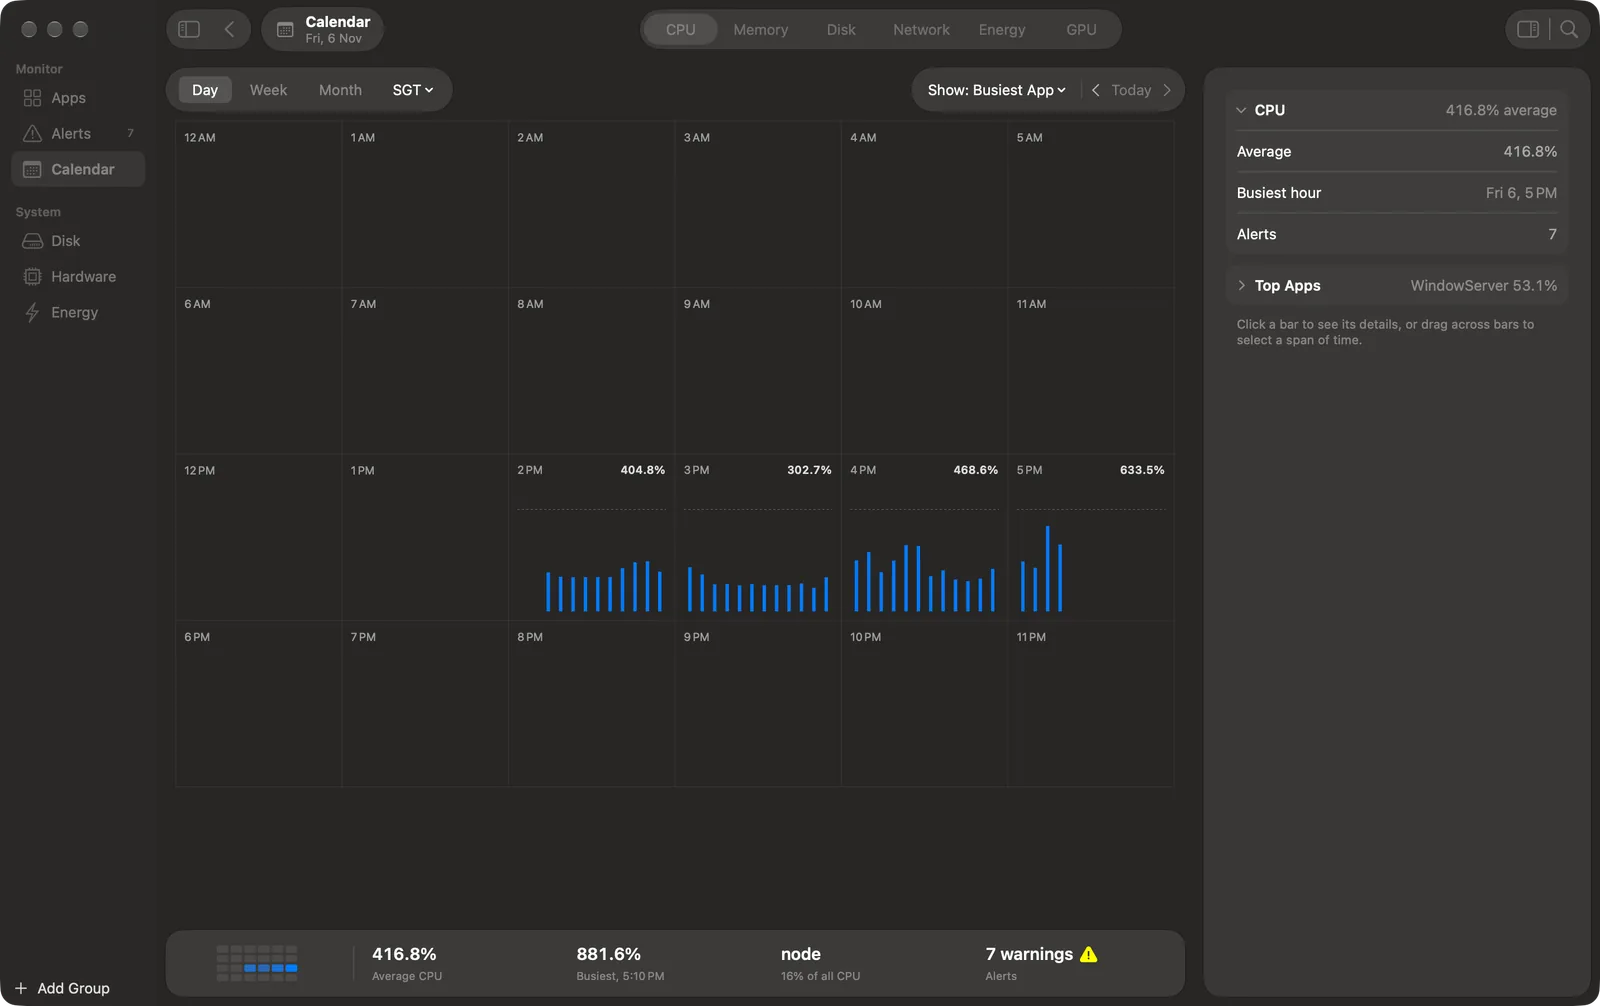
A helper records CPU, memory, disk, energy, network and GPU for each process every 5 seconds, also while the app is closed. Calendar shows each hour and day of the last 90 days, with the busiest app in each cell.
Read about Calendar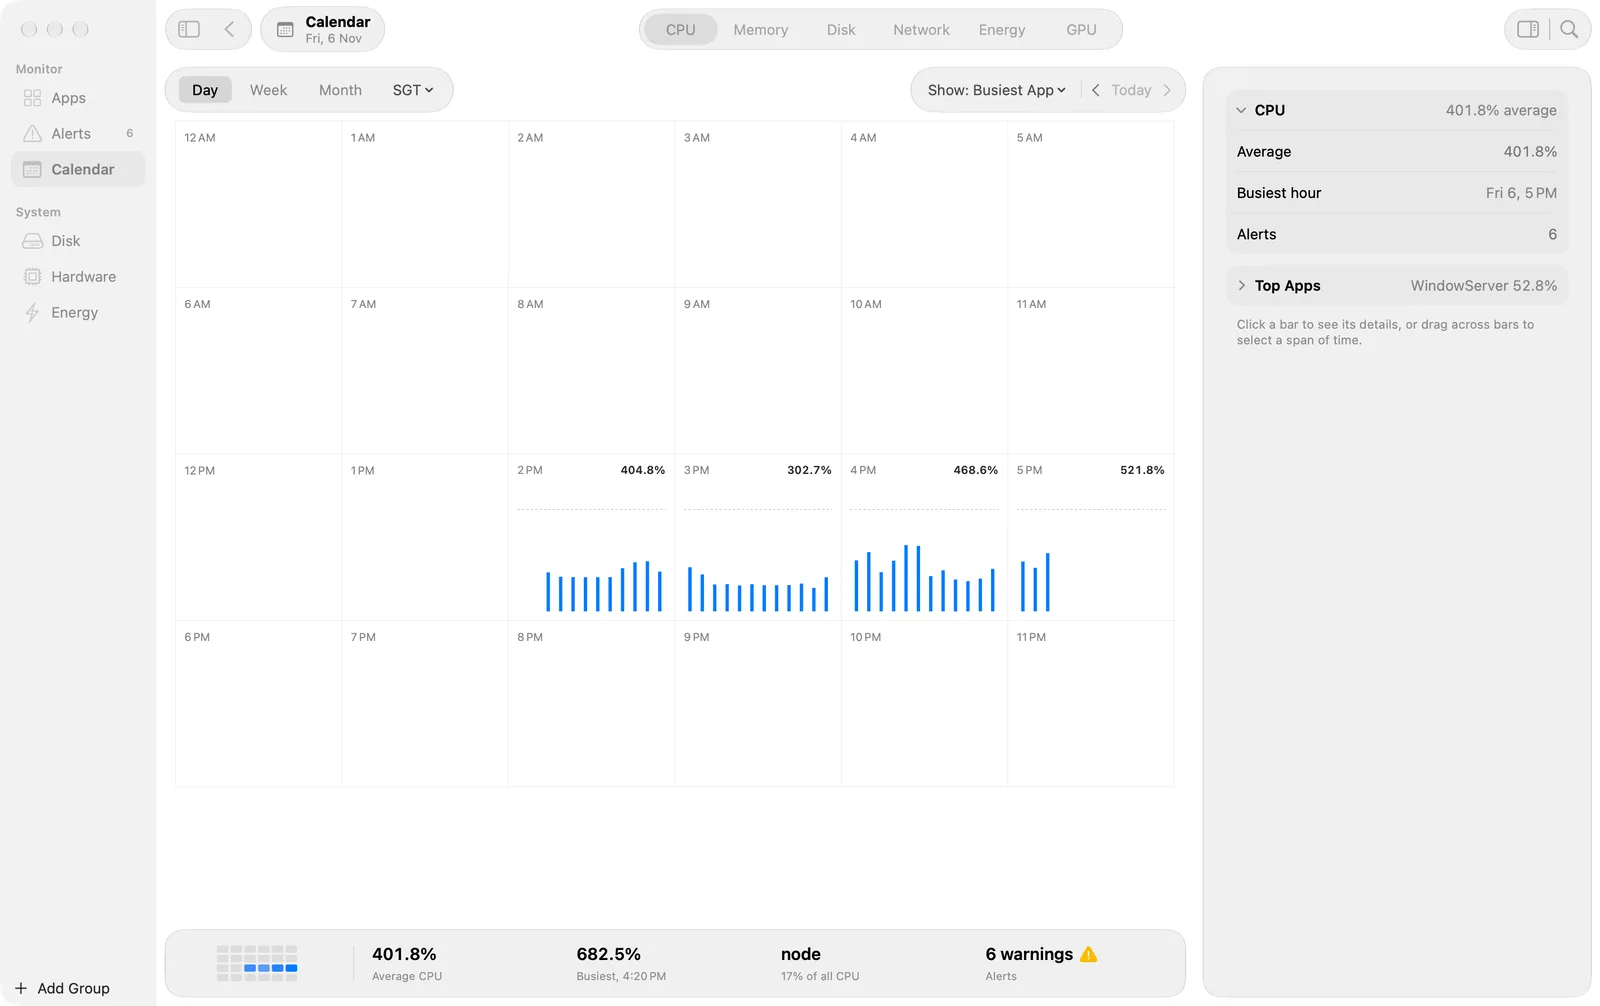
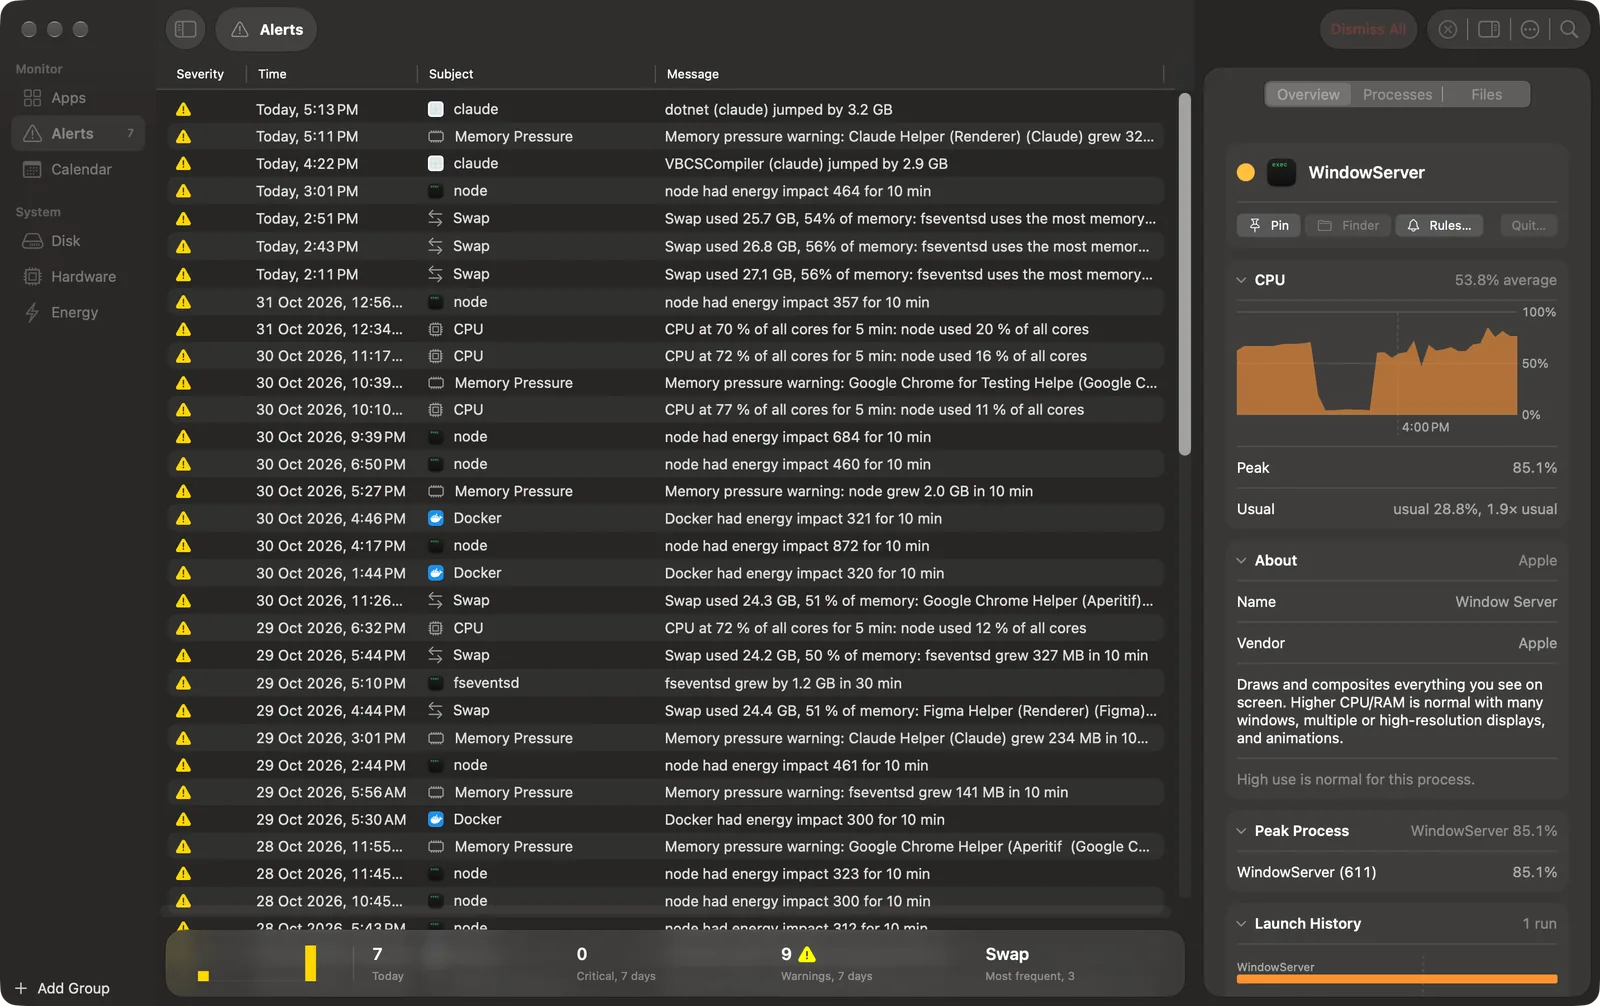
Rules check every app and the Mac as a whole. An alert about the Mac names a likely cause, for example the process whose memory grew most.
Read about Alerts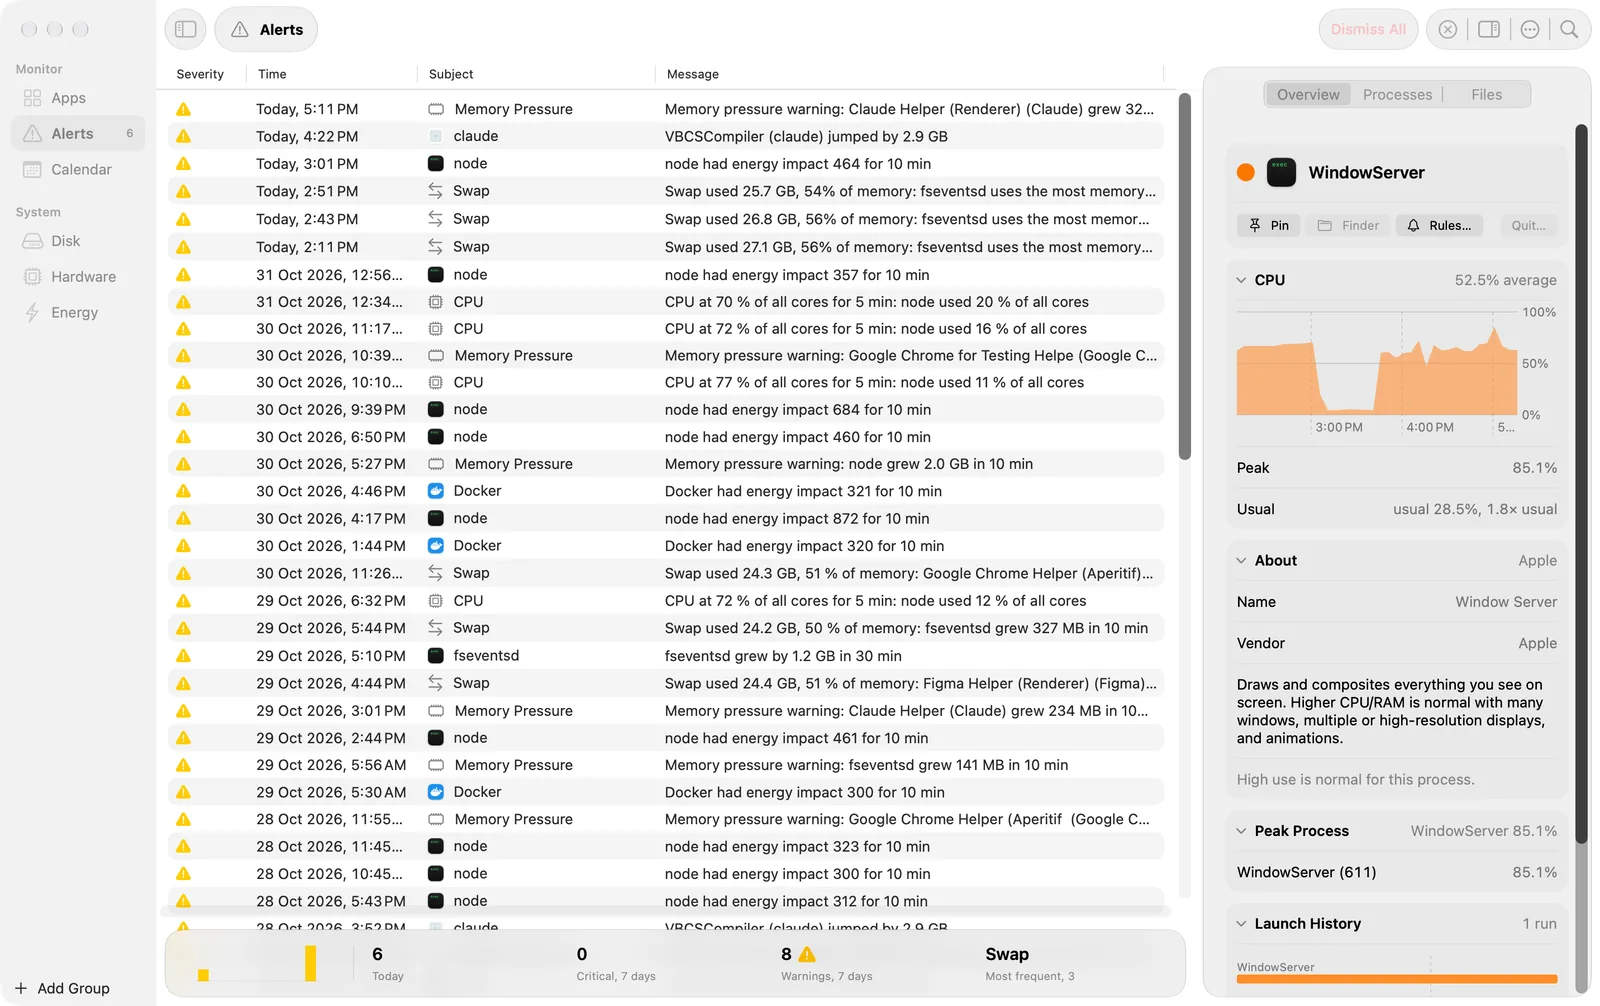
The amx command reads the same history. Its MCP server gives it to AI clients, so you can ask what slowed your Mac down yesterday.
Read about amx and MCPamx call top_apps '{"metric":"memory","from":"-7d"}'amx call summarize '{"from":"-24h"}'amx mcp