---
title: Inspector
description: The pane at the right that shows the details of what you select, or a summary when you select nothing.
---
The inspector is a floating pane at the right of the window. Click the Inspector button in the toolbar, or choose View > Show Inspector, to show or hide it. The window does not change size when the inspector opens. The content column gets narrower.
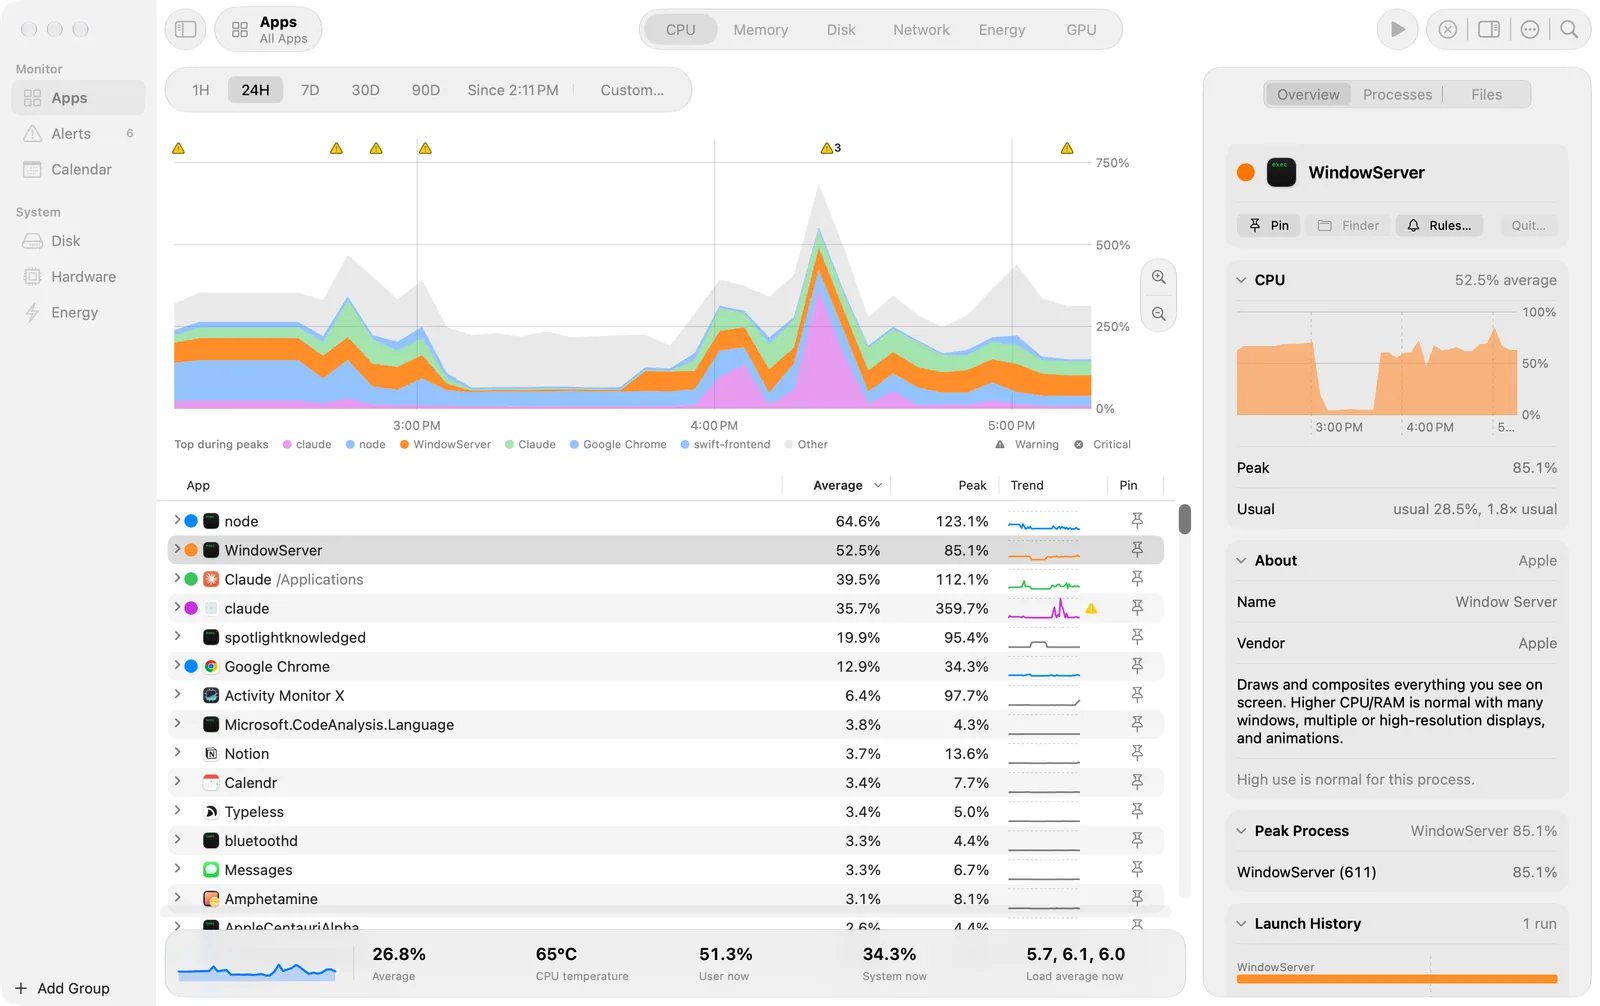
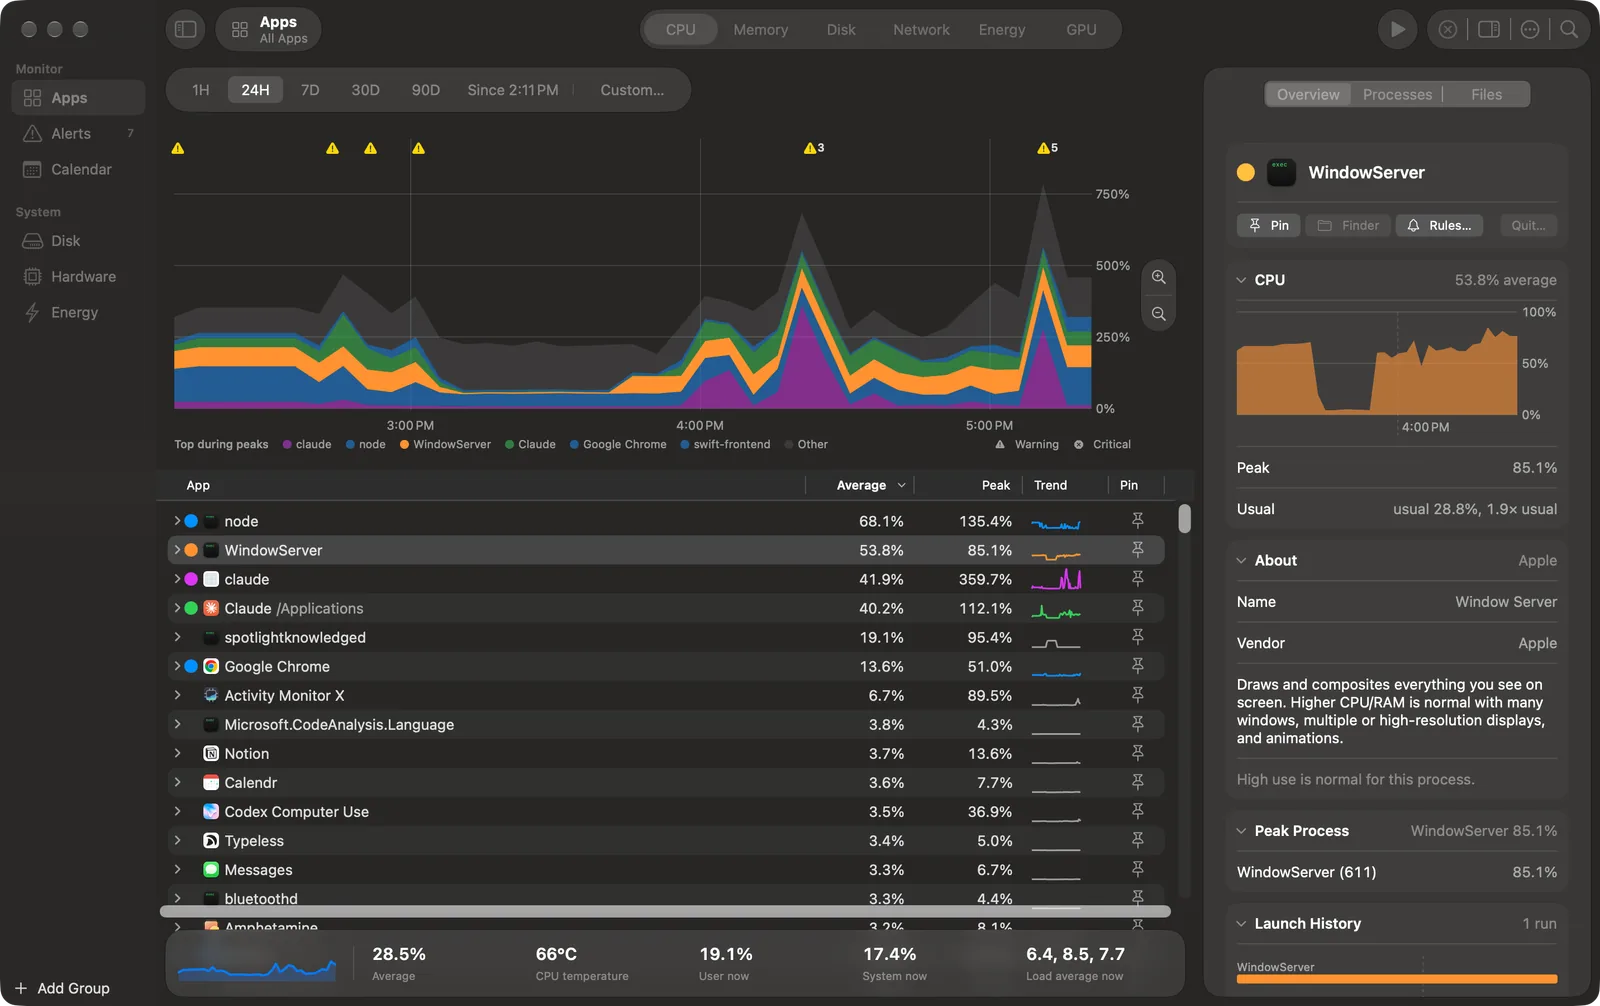 The inspector with WindowServer selected: the action row, the CPU card with Peak and Usual, and the cards below it.
## With an app selected
The pills at the top are **Overview**, **Processes** and **Files**.
### Overview
- **Header:** the app's colour dot, icon and name.
- **Action row:** Pin, Finder, Rules… and Quit…. Quit asks first, and its confirmation also has Force Quit.
- **Metric card:** the chart of the app for the metric. Its summary is the average ("52.5% average"). Its rows are **Peak** and **Usual**. Usual is the typical value of the app for the time shown, as an hourly mean. Live has no Usual row.
- **Launch History:** each run of the app as a bar. Click a run to select that time on the chart.
- **Alerts** of the app. Click an alert to select its time on the chart.
### Processes
The processes of the app, under **Running** and **Exited**, each with a count. The list keeps the selection and works with the arrow keys.
### Files
The files that each process has open, with one card per process and its PID as the summary. Files shows only your own processes: macOS does not let the app read the open files of other users.
## With nothing selected
On Apps, the inspector shows a summary of the Mac:
- **System Health:** memory pressure, swap used, thermal state and uptime. Its summary is the worst state.
- **Top Apps:** the apps with the highest value of the metric.
- **Biggest Changes:** the apps whose use went up or down most, compared with the time before.
- **Alerts:** the count of each kind of alert.
Calendar, Disk, Hardware and Energy show their own summary when nothing is selected. See each screen's page.
## Cards
Each titled section is a card. Click its title to open or close it. A closed card still shows its summary at the right: an average, a peak, a count, a state or a name. The app keeps each card open or closed by its title.
## Alert rules for one app
Click **Rules…** to give the app its own alert values. For each rule, choose **As in Settings**, **Own Values** or **Off**. **Mute alerts for this app** stops all of its alerts. See [Alerts](/alerts) for the rules.