---
title: Calendar
description: The metric for each hour or day as a grid of cells, so you can see when your Mac was busy.
---
Calendar shows the history as a grid. Each cell is a block of time with its mean and the busiest app. Use it to find the days and hours when your Mac was busy, then open them in Apps.
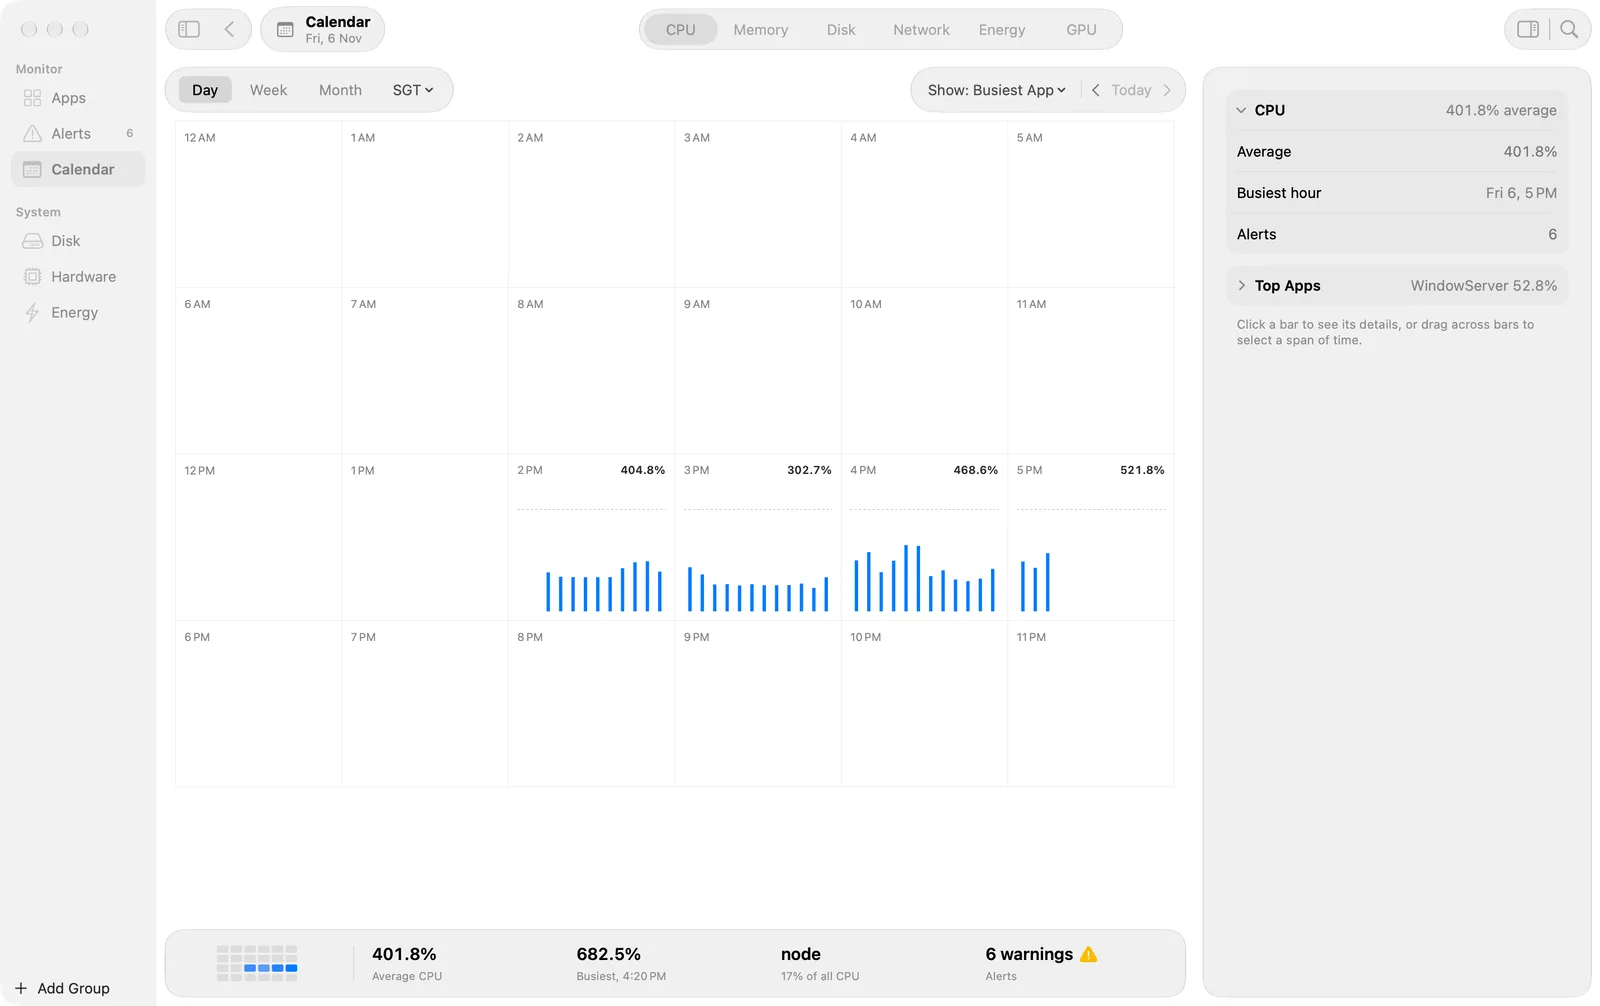
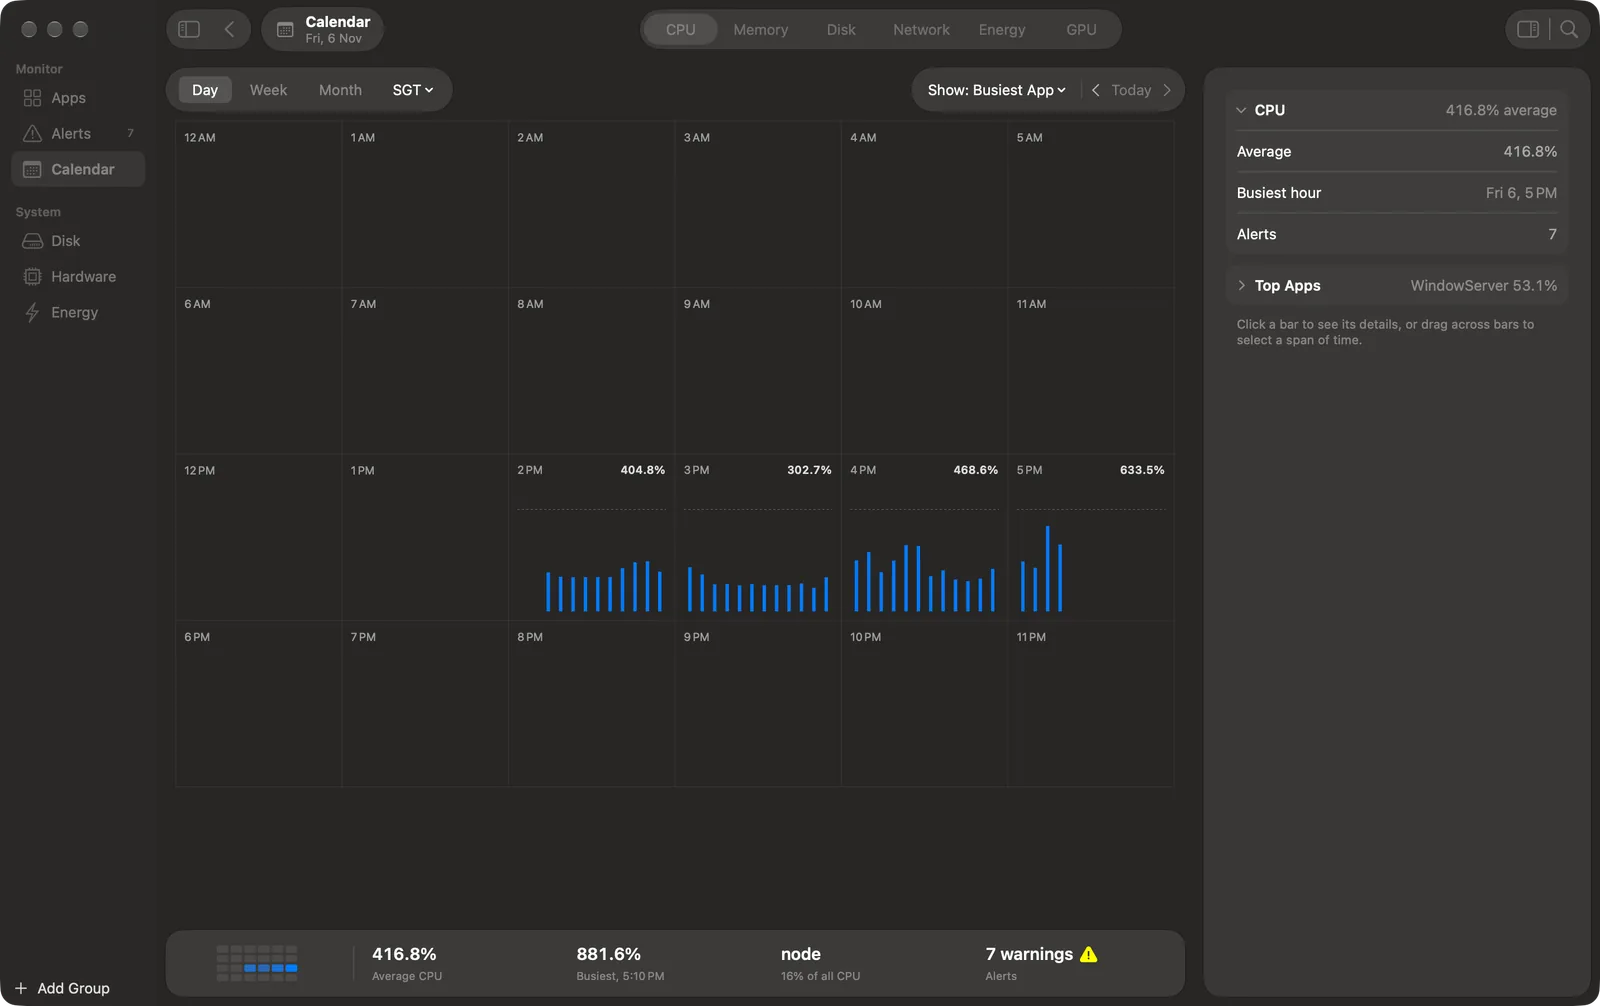 Calendar in Day view. Each hour shows its mean CPU and one bar for each 5 minutes.
## Periods
The bar at the top has **Day**, **Week** and **Month**, the time zone, **Show**, and ‹ **Today** ›.
- **Month** shows one cell for each day. **Week** and **Day** show blocks of hours.
- Double-click a cell to zoom in: Month to Week, Week to Day, Day to Hour.
- To zoom out, press Escape, click the Back button in the toolbar, or choose View > Zoom Out (⌘[). View > Zoom In is ⌘].
- The title in the toolbar says where you are, for example "Week of 1 Nov".
## Cells
- Each cell shows its mean, one line for each part of the cell, and the icon of its busiest app.
- **Show** chooses what the cells count: Busiest App, All Apps, or one of your groups.
- A time with no data, or a time that is still to come, is blank. Its preview says "No data".
- CPU cells use the colours of the System CPU rule: yellow above the warning level and red above the critical level. Memory cells use the memory pressure level. The other metrics have no status colour.
- Hover a cell for a preview with the top apps.
In Day and Hour, the unit is the bar: a bar for each 5 minutes in Day, and for each minute in Hour. Left and Right move the selected bar. Shift with Left or Right extends the selection. Double-click a bar in Day to open that hour.
## Select and compare
- Click a cell to see it in the inspector: its mean, its peak and its top apps.
- Drag across cells to select a span. The inspector compares the span with the span before it.
- Right-click a cell for Show Week, Show Day or Show Hour, and **Show in Apps**, which opens that time on the [Apps](/apps) screen.
## Time zones
The pop-up beside Day, Week and Month shows the time zone ("SGT"). Choose another zone to see every screen in that zone: dates, day boundaries and chart axes. Week and Day can also add hour labels for more zones.
## The footer
The footer shows the cells of the period as a small heat grid, then the mean, the busiest time, the top app with its share, and the alert counts.