---
title: Apps and timeline
description: The main screen. A chart of the busiest apps over time, above a table of every app.
---
Apps is the first screen in the sidebar. It shows one metric for one time range: a chart at the top and a table of apps below it.
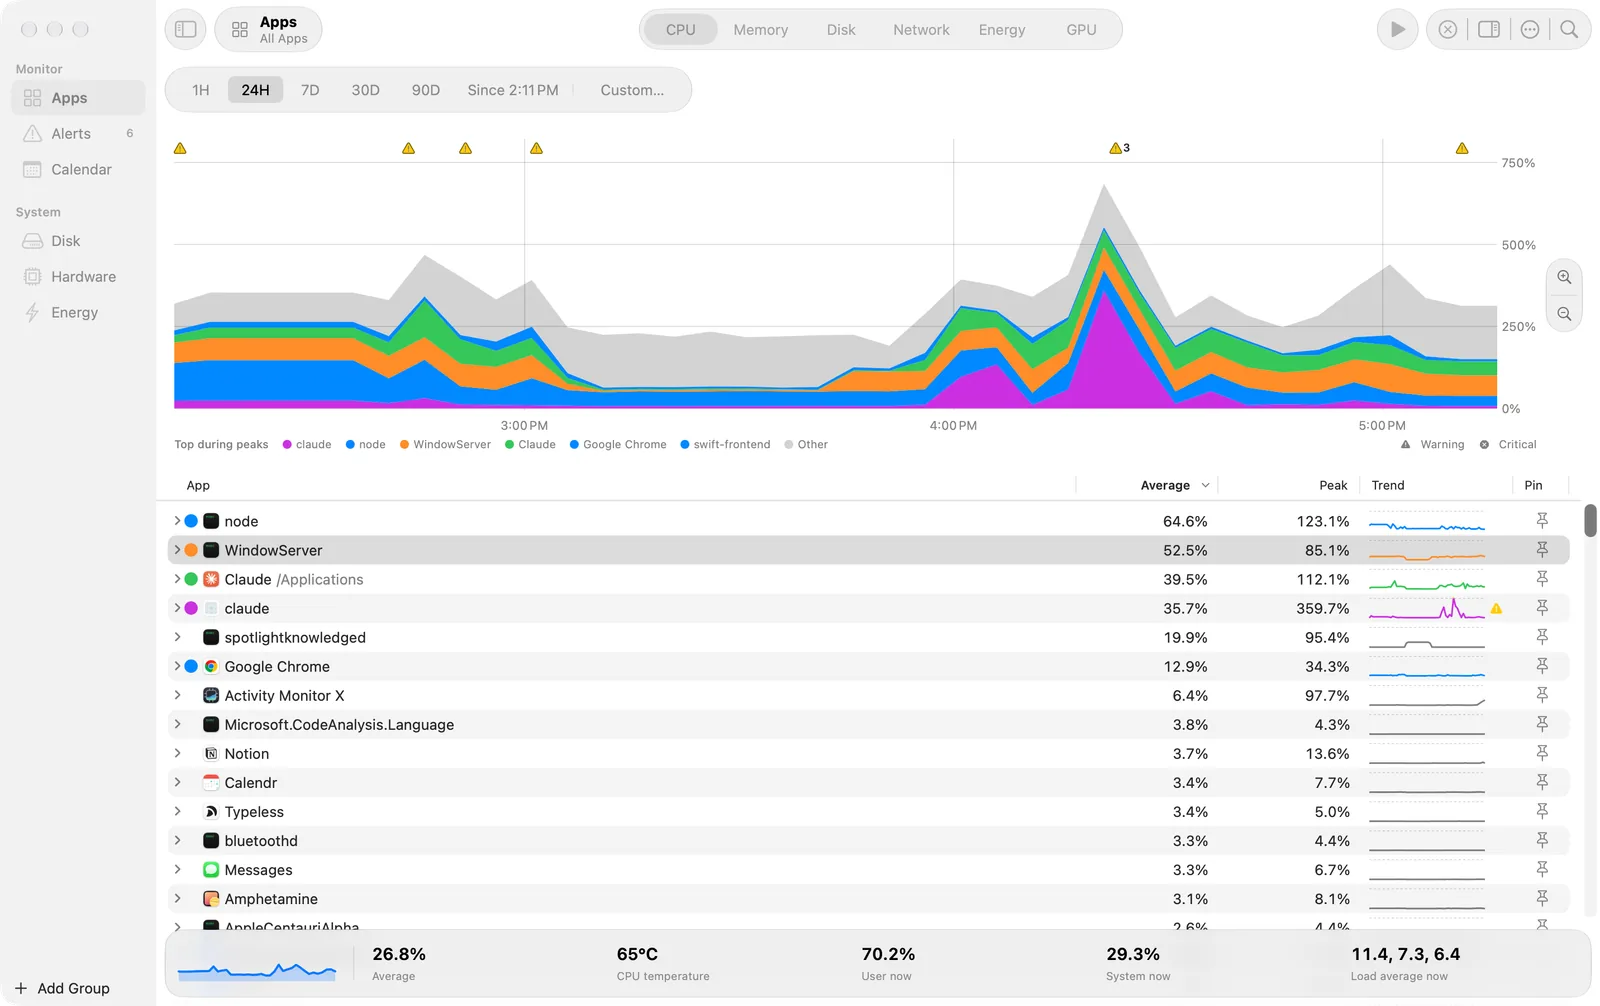
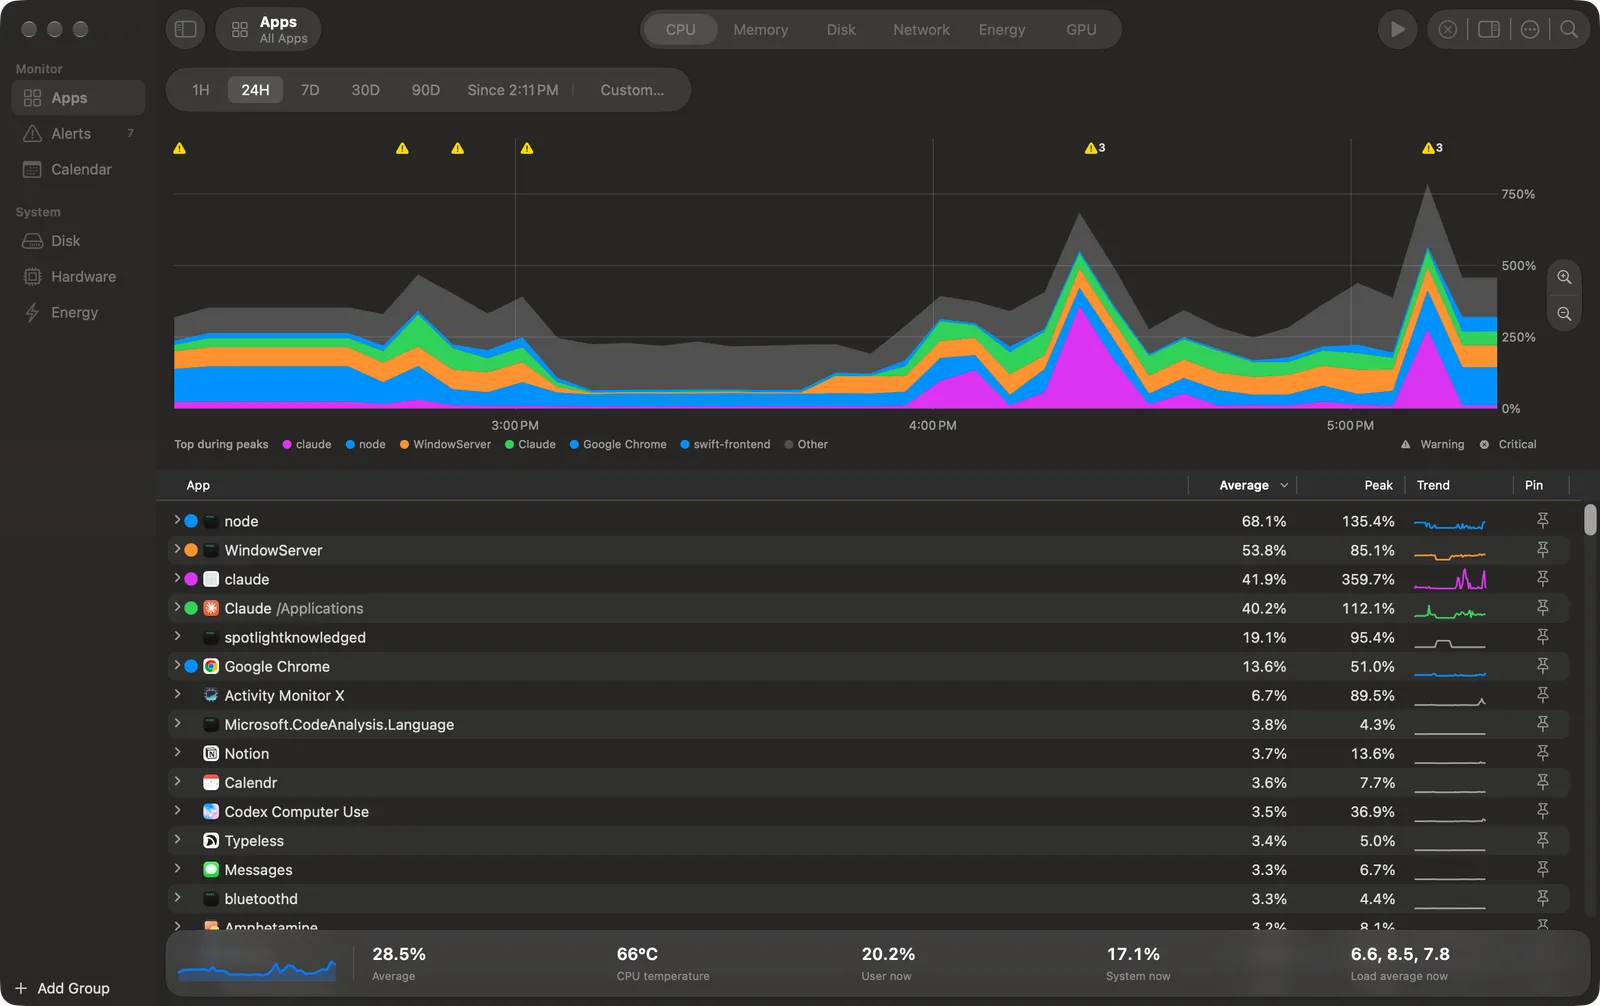 Apps with CPU for the last 24 hours. The chart shows the top apps of the busiest times in their own colours, and Other in grey.
## Choose the metric and the time
- **Metric:** the segments in the toolbar: CPU, Memory, Disk, Network, Energy and GPU. The Metric menu has the same items. In a narrow window the segments become a pop-up.
- **Range bar:** 1H, 24H, 7D, 30D and 90D, then the window as short text ("Since 2:11 PM"), then Custom…, which opens From and To pickers.
- **Live:** the round button in the toolbar, or ⌘L. Live shows the last 5 minutes and updates each second. Click it again to go back to the range you had before.
## Read the chart
- The five apps that add most to the busiest times of the chart get their own colours. The legend calls them **Top during peaks**. All other apps are in **Other**, in grey.
- An app with a colour that you chose always has its own band. To choose a colour, click the colour dot of the app in the table.
- Hover the chart to see the values at that time in a bubble.
- Marks above the chart show events: a triangle for a warning, an octagon for critical. Events that are close together share one mark with a count. Click a mark to see each event.
## Zoom
- Drag across the chart to select a span.
- **Zoom In** on the pill at the right of the chart makes the span the range. With no span, it goes to the next narrower range (90D, 30D, 7D, 24H, 1H) around the shown window. **Zoom Out** goes to the next wider range.
- View > Zoom In is ⌘], and View > Zoom Out is ⌘[.
- **Show Whole Range**, under the chart, clears the span. Escape also clears it.
## The table
| Column | What it shows |
| --- | --- |
| App | The app, with its icon and colour dot. Click the arrow to show its processes. |
| Average | The average of the metric over the range or the span. |
| Peak | The highest value in the range or the span. |
| Trend | A small chart of the range. The part above the alert threshold is yellow, with a dashed line at the threshold. |
| Pin | Puts the app in the sidebar, with its own chart. See [Groups and pinned apps](/groups). |
- Click a column header to sort. Right-click the header to show the optional PID and User columns.
- Right-click an app for Quit…, Force Quit…, Copy PID, Show in Finder and Colour. Quit and Force Quit ask first.
- Select a row and press ⌘C to copy it as it reads, for example "Safari Web Content (812)".
- Search (⌘F, or the magnifier at the end of the toolbar) filters the table.
- View > Hide Quiet System Processes hides processes under `/System`, `/usr`, `/bin` and `/sbin` whose average is very small. They count in Other.
Each process belongs to the app that macOS holds responsible for it. A helper process of Safari counts under Safari. A command that you run in a terminal app is its own app. [How it works](/how-it-works) tells more.
## The footer
The strip at the bottom shows the trend of the whole Mac for the metric, then its numbers now and for the range. For CPU: the average, the CPU temperature, the user and system CPU now, and the load average.
## When the helper stops
If the app cannot reach the helper, Live keeps the last data and says "Helper not reachable. Data as of" the time. Settings > Helper shows the install line again. See [Install](/install).