---
title: Alerts
description: The alerts that the rules wrote, and how to set the rules.
---
The helper checks rules while it records, also when the app is closed. When a value passes a rule's threshold, the helper writes an alert. The Alerts screen lists them, newest first.
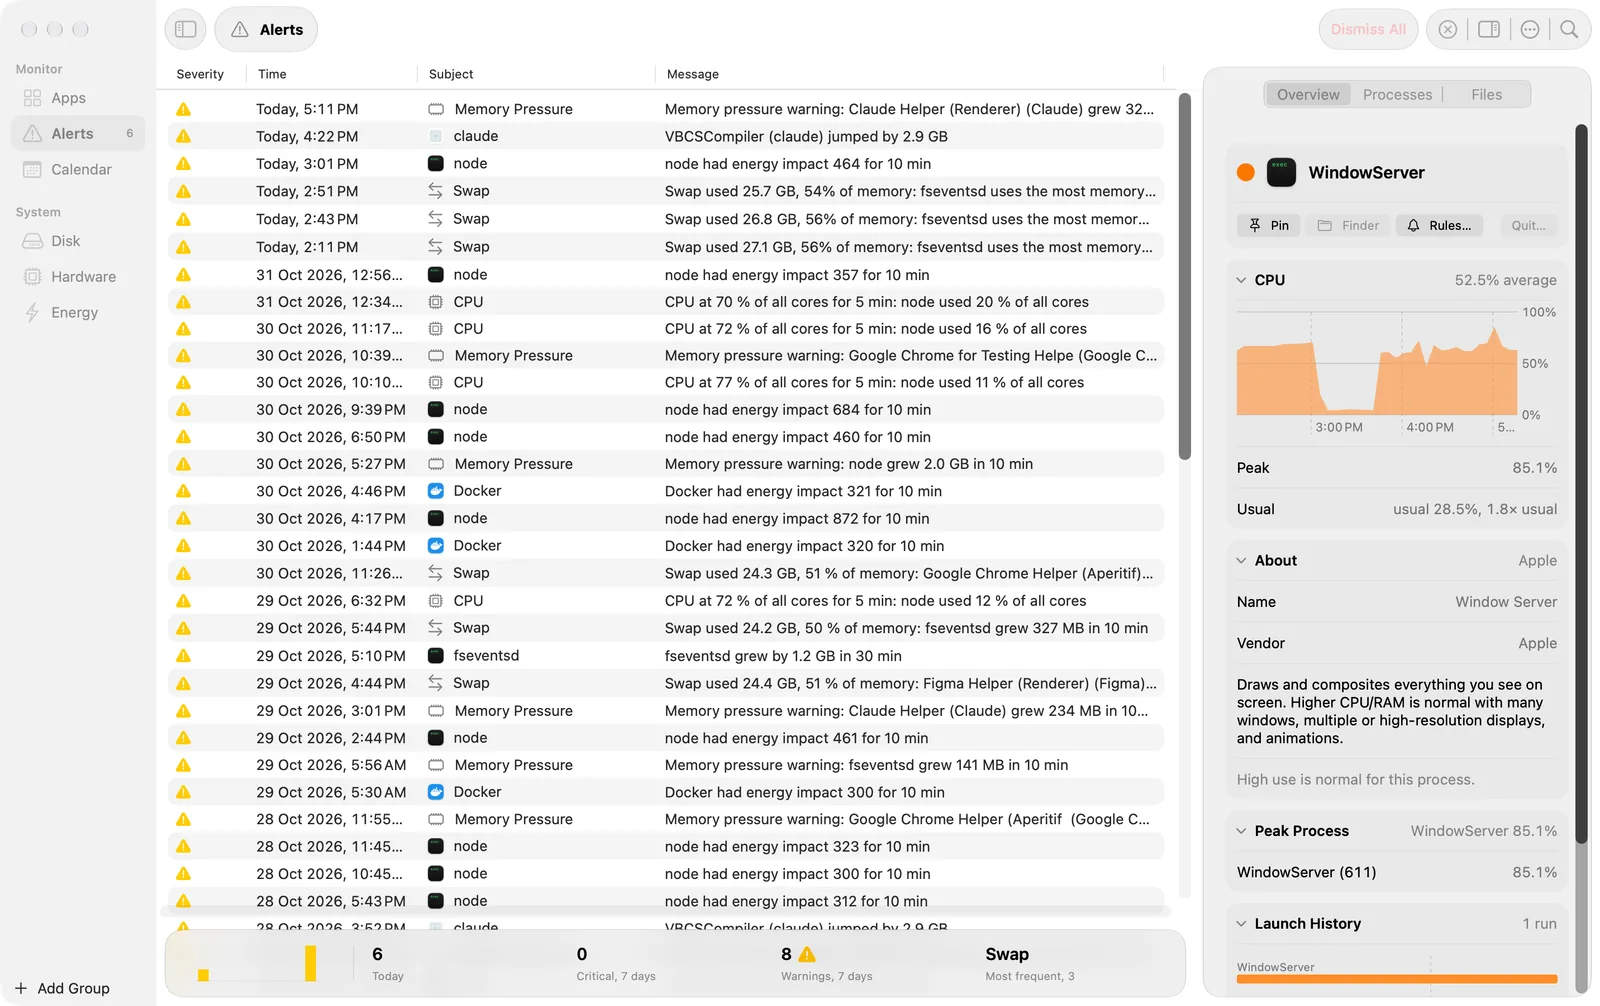
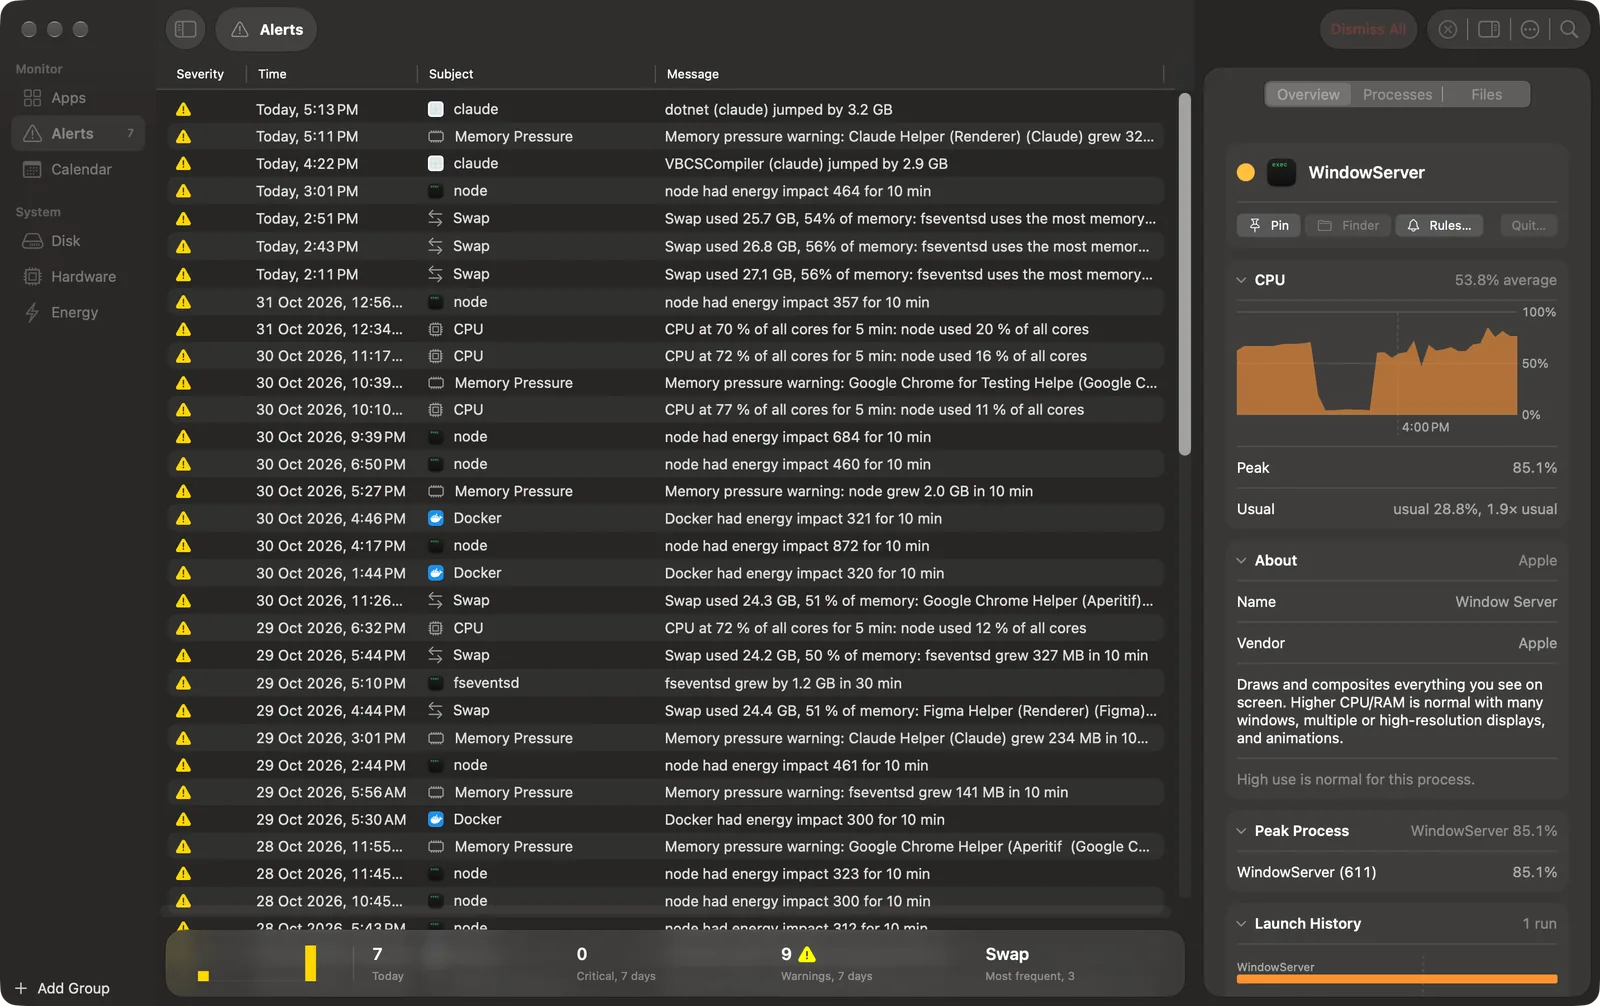 Alerts as a table: severity, time, subject and message. An alert about the Mac names a likely cause.
## The table
| Column | What it shows |
| --- | --- |
| Severity | A triangle for a warning (yellow) or an octagon for critical (red). |
| Time | "Today, 15:42", "Yesterday, 22:31", or else the date. |
| Subject | The app, or for a rule about the Mac, what the rule watches: CPU, Memory Pressure, Swap and so on. |
| Message | What happened, for example "CPU at 72 % of all cores for 5 min: node used 12 % of all cores". |
- Right-click an alert for Dismiss, Restore and Copy Message.
- **Dismiss All**, in the toolbar, dismisses the alerts shown. It does not ask first, because you can restore them. View > Show Dismissed Alerts shows them again.
- The sidebar shows the count of unread alerts.
- The footer shows the last 7 days as bars by severity, then today's count, the critical and warning counts of the 7 days, and the most frequent subject.
## Rules
| Rule | About | Alerts when |
| --- | --- | --- |
| Sustained CPU | Each app | An app stays above a CPU level for a time. |
| Memory Growth | Each process | A process grows steadily by an amount over a time. |
| Memory Jump | Each process | A process grows by an amount in under a minute. |
| Disk Writes | Each app | An app writes an amount to disk in one hour. |
| Network | Each app | An app receives and sends more than a rate for a time. |
| Energy Impact | Each app | An app stays above an energy impact for a time. |
| GPU | Each app | An app stays above a GPU use for a time. |
| System CPU | The Mac | The CPU of all cores stays above 70 % (warning) or 90 % (critical) for 5 minutes, by default. |
| Memory Pressure | The Mac | Memory pressure reaches a level. |
| Thermal State | The Mac | The thermal state stays at or above a level for a time. |
| Swap Used | The Mac | Swap passes a share of the memory. |
| Free Disk Space | The Mac | Free space on the startup volume falls below a level. |
After an alert, a rule is quiet for a time, so one problem does not give many alerts. Settings shows each rule's quiet time under its values. An alert about the Mac names a likely cause, for example the process whose memory grew most.
## Set the rules
Open Settings > Alerts.
- **Preset:** Relaxed, Balanced (the default) or Strict. A preset calculates the values for your Mac from its cores, its memory and the size of its startup volume. When you change a value, the preset becomes Custom.
- **App Rules** and **System Rules:** each rule has a switch. Click a rule to edit its values.
- **Banners for:** Critical Only (the default) or All Alerts. With Critical Only, a warning goes to Notification Center without a banner.
To give one app its own values, or to mute it, select the app and click **Rules…** in the [inspector](/inspector#alert-rules-for-one-app).
## From Terminal
`amx call events '{"kind":"alert","from":"-7d"}'` prints the alerts of the last 7 days. See [amx and MCP](/cli).